Cohort Analysis

Myroslav Protsan
SEO Specialist, Reteno
July 23, 2025
SEO Specialist, Reteno
July 23, 2025
Marketers and product teams often face an overwhelming volume of metrics. Cohort analysis is a powerful method for gaining insights into a company’s audience behavior. By grouping users based on a common starting point, cohort analysis structures raw data to reveal patterns in retention, engagement, and customer lifetime value. It offers a focused look at user behavior over time, helping to identify what drives loyalty and what leads to churn.
Cohort analysis is a behavioral analytics technique that segments users based on a common characteristic, such as the date they signed up or performed a specific action, and monitors how each group’s behavior evolves.
Instead of averaging everyone together, cohort analysis isolates patterns that typical dashboards blur. You can see, for instance, whether people who installed your app in January behave differently from those who arrived in April, or whether shoppers who used a discount code return more frequently than full-price buyers. Because cohort analysis follows the same cohort week after week (or month after month), it exposes subtle retention curves, engagement dips, and conversion surges that surface long after an initial campaign ends.
Cohort analysis is a trusted method for marketers and product managers because it provides actionable insights grounded in time-based user behavior. Marketers use it to evaluate the quality of user acquisition, assess the effectiveness of marketing channels, and measure customer lifetime value. Product managers depend on cohort analysis to determine how product updates or feature releases impact user behavior over time. In essence, cohort analysis offers a reliable framework for understanding how different user segments engage, convert, and retain long after their initial interaction.
Cohort analysis typically follows a four-step process.
Because cohort analysis evaluates each group relative to its timeline, it filters out noise from external variables such as seasonality or rapid user growth. For example, a large cohort that retains just 10% of users after 30 days may be less successful than a smaller one that retains 40%. With cohort analysis, these comparative trends become immediately visible, enabling data-driven decisions grounded in behavioral evidence.
The classic form of cohort analysis groups users by when they first arrived. Acquisition cohorts (sometimes called time-based cohorts) tell you how different signup waves stick around. If Day-7 retention suddenly drops for cohorts that joined after a pricing change, you know the change hurt stickiness. Because acquisition cohorts anchor around the onboarding moment, they are perfect for benchmarking the “first impression” your product makes.
Behavioral cohorts regroup users based on what they do: completing a second purchase, mastering level three, sharing content, or activating push notifications. This flavor of cohort analysis uncovers why one slice of your audience becomes power users while another churns. By comparing retention curves of behavioral cohorts, you can prove that people who finish onboarding videos, for example, remain engaged far longer than those who skip them.
Sometimes you need to mix the two approaches. Before layering in behavior, attribute-based cohorts segment users by geography, device, or subscription plan. Hybrid cohort analysis lets you see, for example, whether iOS customers who redeem a referral code convert better than Android customers who do the same. Flexibility is built in: as long as a cohort shares a single defining trait, cohort analysis can track its journey.
Cohort analysis allows you to pinpoint the declining stage of user retention. Instead of relying on bulk, untargeted re-engagement campaigns, you can take action at the first signs of a cohort losing interest. This targeted approach helps reduce churn before it escalates.
Patterns in cohort analysis highlight which in-app behaviors correlate with long-term engagement. If cohorts that explore the community forum within 48 hours retain 30 % longer, you have a clear directive: guide every newcomer toward that forum.
By pairing acquisition cohorts with cost data, cohort analysis shows which channels deliver high-LTV users and which burn budget on one-and-done visitors. Armed with that clarity, you can scale campaigns that earn back ad spend and pause those that don’t.
When cohort curves show steep drop-offs, they reveal specific weaknesses in the user journey. For example, a sharp decline after Day 3 may indicate issues with onboarding tutorials, while a noticeable drop following a paywall could highlight friction in the conversion flow. These insights enable product and design teams to make informed decisions based on actual user behavior rather than assumptions.
AB tests often focus on immediate lifts, but cohort analysis tracks the same cohorts for weeks or months, validating whether a bump in Day-1 activation translates into higher 90-day retention and greater customer lifetime value. It’s a reality check that guards against short-term wins that fade fast.
Start every cohort analysis with a question. Do you want to know seven-day retention or purchase frequency after a discount? Choose one KPI and the cohort attribute that will most directly answer it. Clarity in this step keeps the entire cohort analysis focused.
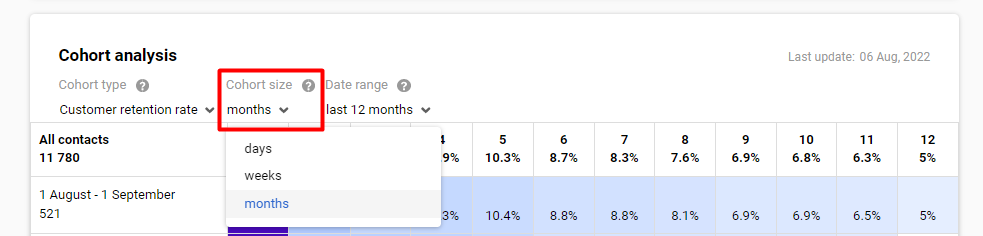
Export user events, map them to your chosen intervals, and build the cohort matrix. Modern analytics tools generate cohort analysis tables automatically, but even a spreadsheet works. Each cell should show the metric’s value for that cohort at that time slice — retention percentage, average order value, engagement minutes, and so on.

Now read the heatmap like a weather forecast. Lines of cool blues tell a different story than streaks of warm reds. Look for sudden drops, surprisingly stable rows, or standout columns. This interpretive stage is where cohort analysis converts numbers into narratives about user behavior.
Insights without action are not working. If cohort analysis pinpoints Day-2 churn among mobile gamers, streamline the Day-2 experience. If it spotlights stellar retention in referral cohorts, boost referral incentives. Then rerun the cohort analysis to confirm improvement. Iteration is where compounding gains hide.
A fitness app might track weekly retention for cohorts formed by install date. When cohort analysis shows a recurring dip between Week 2 and Week 3, product teams can enrich that phase with milestone badges or motivational push notifications. Engagement metrics climb, and subsequent cohort analysis confirms the win.
By segmenting cohorts based on acquisition source, such as organic search, social media, or influencer campaigns, teams can track not just initial conversion but long-term retention. For instance, influencer-driven cohorts might convert rapidly but disengage within weeks, whereas organic search cohorts may convert more slowly but remain active longer. With this data, marketers can shift investments toward channels that drive sustainable customer lifetime value.
After launching a new wishlist feature, an e-commerce platform groups users into cohorts who used the wishlist in their first session versus those who ignored it. Cohort analysis proves the wishlist cohort’s repeat-purchase rate is 25 % higher, validating further investment in wishlist enhancements and targeted in-app prompts.
Short-term experiments may celebrate a 5% lift in Day-1 activation. Cohort analysis dives deeper, following each test cohort for 90 days. If the lift evaporates by Week 4, the “winning” variant doesn’t truly win. Iterating until a sustained uplift appears ensures every release drives durable growth.
Retail businesses can analyze cohorts by purchase month to understand how customer behavior varies across seasonal peaks. For example, Black Friday shoppers may purchase frequently but at lower average order values than spring cohorts, who spend more per order. These insights help optimize promotional strategies, inventory management, and pricing decisions.
Cohort analysis offers clarity grounded in time-based user behavior. It reveals not just what is happening, but when and why. Whether you're reducing churn, allocating marketing spend more efficiently, or improving product usability, cohort analysis replaces guesswork with actionable insight. Adopt it, iterate on it, and let its depth inform every decision tied to retention, conversion, and revenue growth.